You’re leaving $21,000 in unvested 401(k) matches behind with every job hop—here’s the exact formula to know if a raise actually covers that loss.
By using the Gilinoh Raise & Job-Hop Velocity Calculator, mid-career professionals can quantitatively evaluate the financial trade-offs of a jobs switch, revealing that even a 12% raise may be insufficient to offset unvested employer match forfeiture—thus providing a data-driven framework for negotiating a signing bonus that neutralizes the golden handcuff dilemma.
Short Answer
In short: By using the Giniloh Raise & Job-Hop Velocity Calculator, mid-career professionals can quantitatively evaluate the financial trade-offs of a jobs switch, revealing that even a 12% raise may be insufficient to offset unvested employer match forfeiture—thus providing a data-driven
Key Takeaways
- Evaluate a new job offer by calculating the total ‘exit cost’ of unvested 401(k) matches and performance bonuses to ensure a salary increase results in a true net gain.
- Account for the ‘Switching Deficit,’ a phenomenon where a higher starting salary can be offset within three years by lower annual raises and the loss of deferred compensation.
- Use the specific dollar value of forfeited benefits as a professional negotiation tool to request a sign-on bonus that compensates for the financial loss of leaving a current role.
- Prioritize long-term wealth velocity over immediate monthly cash flow by modeling your financial trajectory across several years for both ‘stay’ and ‘switch’ scenarios.
Introduction: The True Cost of a Jobs Switch – Why You Need a Calculator
Take the case of Sarah, a professional I recently consulted with. She received a job offer with a 12% salary increase and a senior title, which seemed like an easy win on the surface.
The new company also promised a culture that prioritized the work-life balance she currently lacks. In my experience, these are the moments where emotions often override math. Sarah felt the new role fit her long-term goals and offered an immediate boost to her monthly take-home pay.
However, I noticed a critical detail: Sarah was two years into a three-year “cliff” vesting schedule for her employer’s 401(k) contributions. If she resigned today, she would walk away from over $21,000 in unvested capital. This is a financial reality that many professionals overlook when they focus only on a higher base salary.
In this case, the 12% raise might take nearly two years just to recover the lost retirement funds. This scenario is a classic example of what I call the “golden handcuffs” dilemma. It happens when the cost of leaving—due to lost benefits or deferred pay—is higher than the immediate gains of a new offer.
The Necessity of Quantitative Analysis in Career Transitions
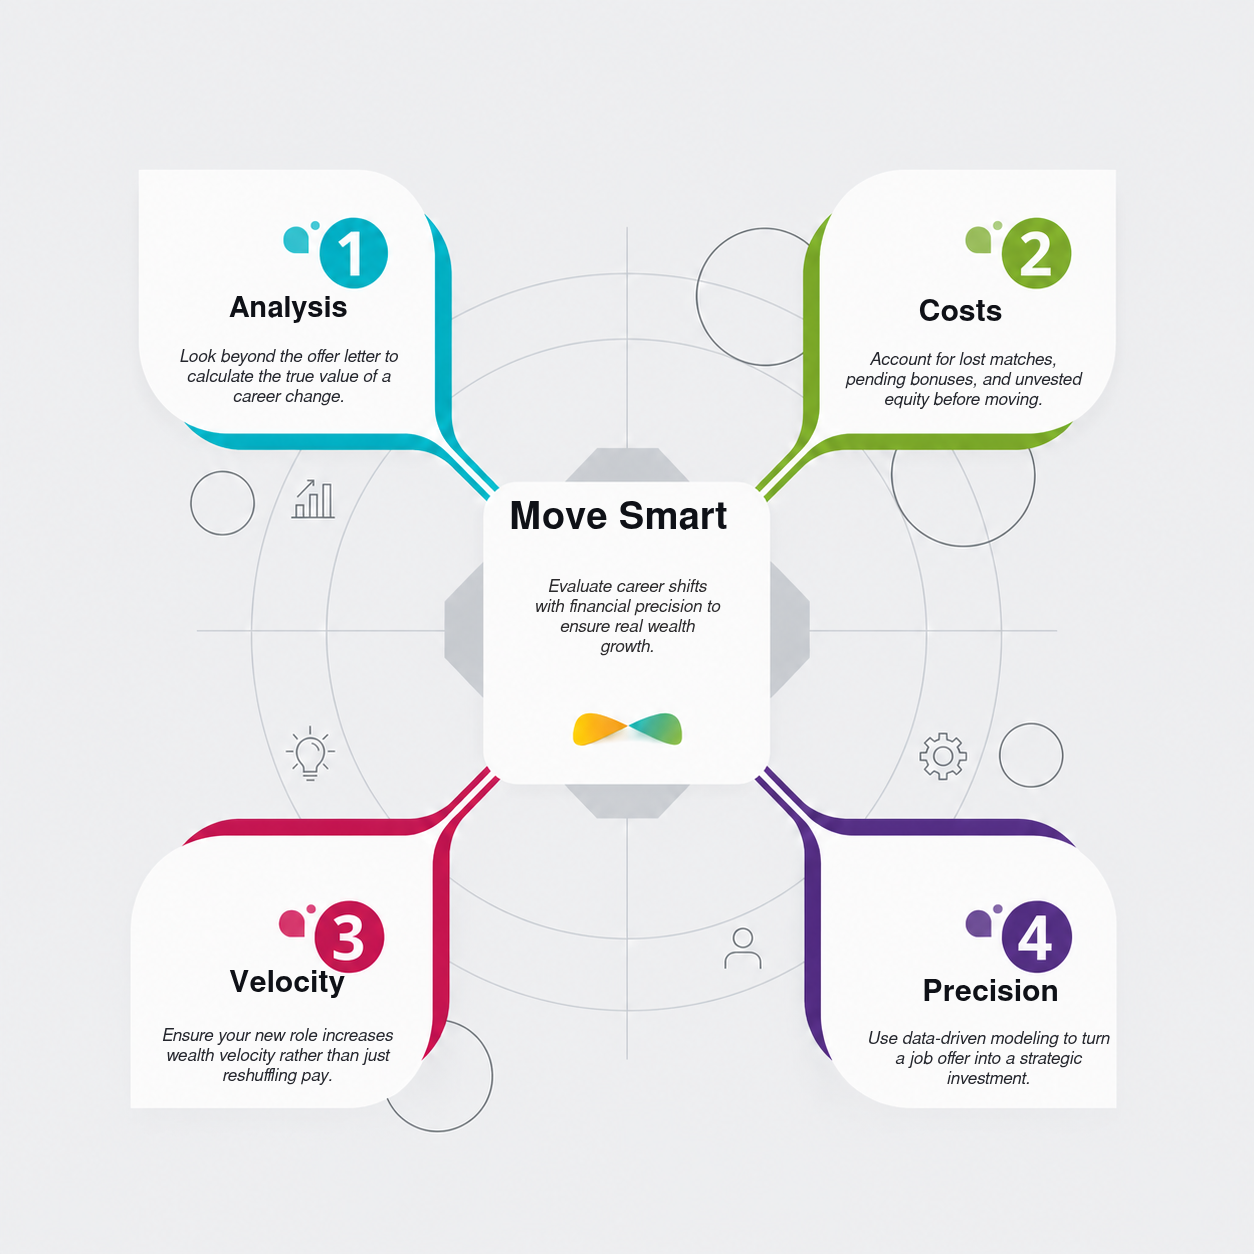
Without a clear mathematical approach, a career move that looks like a step forward can actually be a lateral or even a backward financial shift. I believe a job switch should be evaluated with the same care as a major investment. A standard offer letter only tells part of the story.
To understand the true value of a change, you must account for lost matches, pending bonuses, equity schedules, and the specific costs of moving. Professionals who skip this analysis risk slowing their wealth growth while thinking they are moving ahead. Data from the Atlanta Federal Reserve Bank shows that wage growth for job switchers has consistently outpaced stayers since 2011.
However, national averages are broad and do not account for the details of high-level pay packages. A 12% raise is a common goal, but its value depends entirely on what you leave behind. If that raise is canceled out by the loss of a large unvested match, the benefit of switching disappears.
Strategic Movement and Wealth Velocity
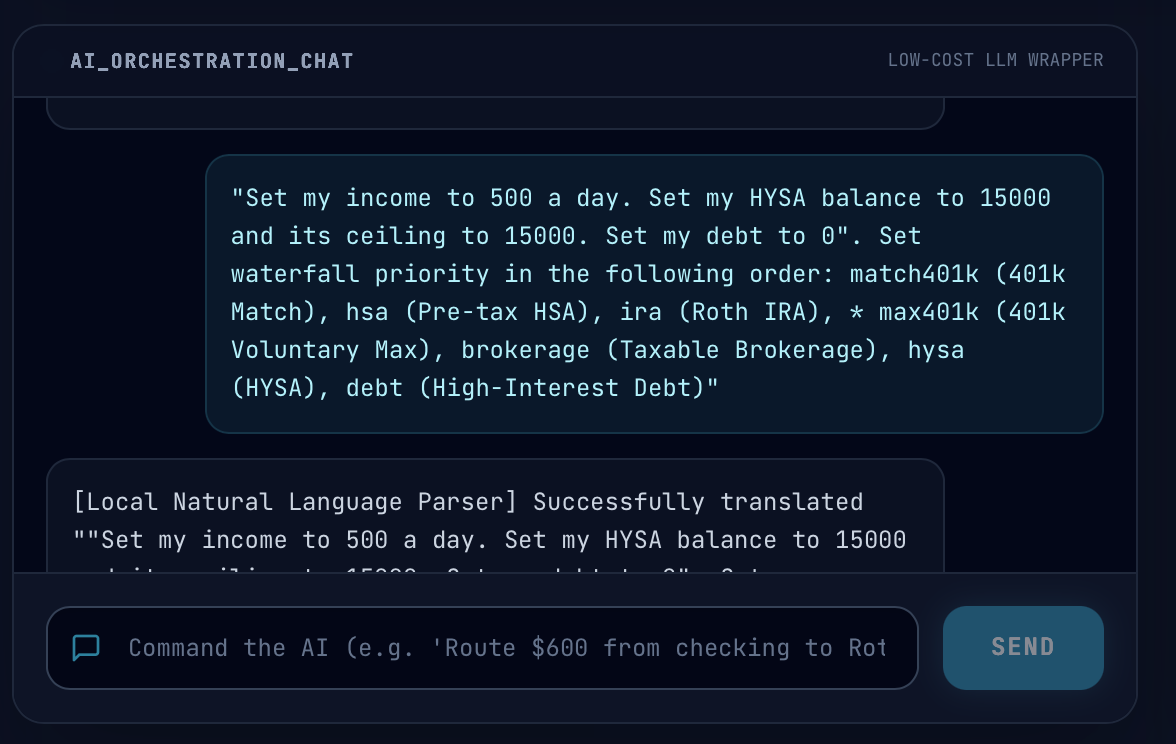
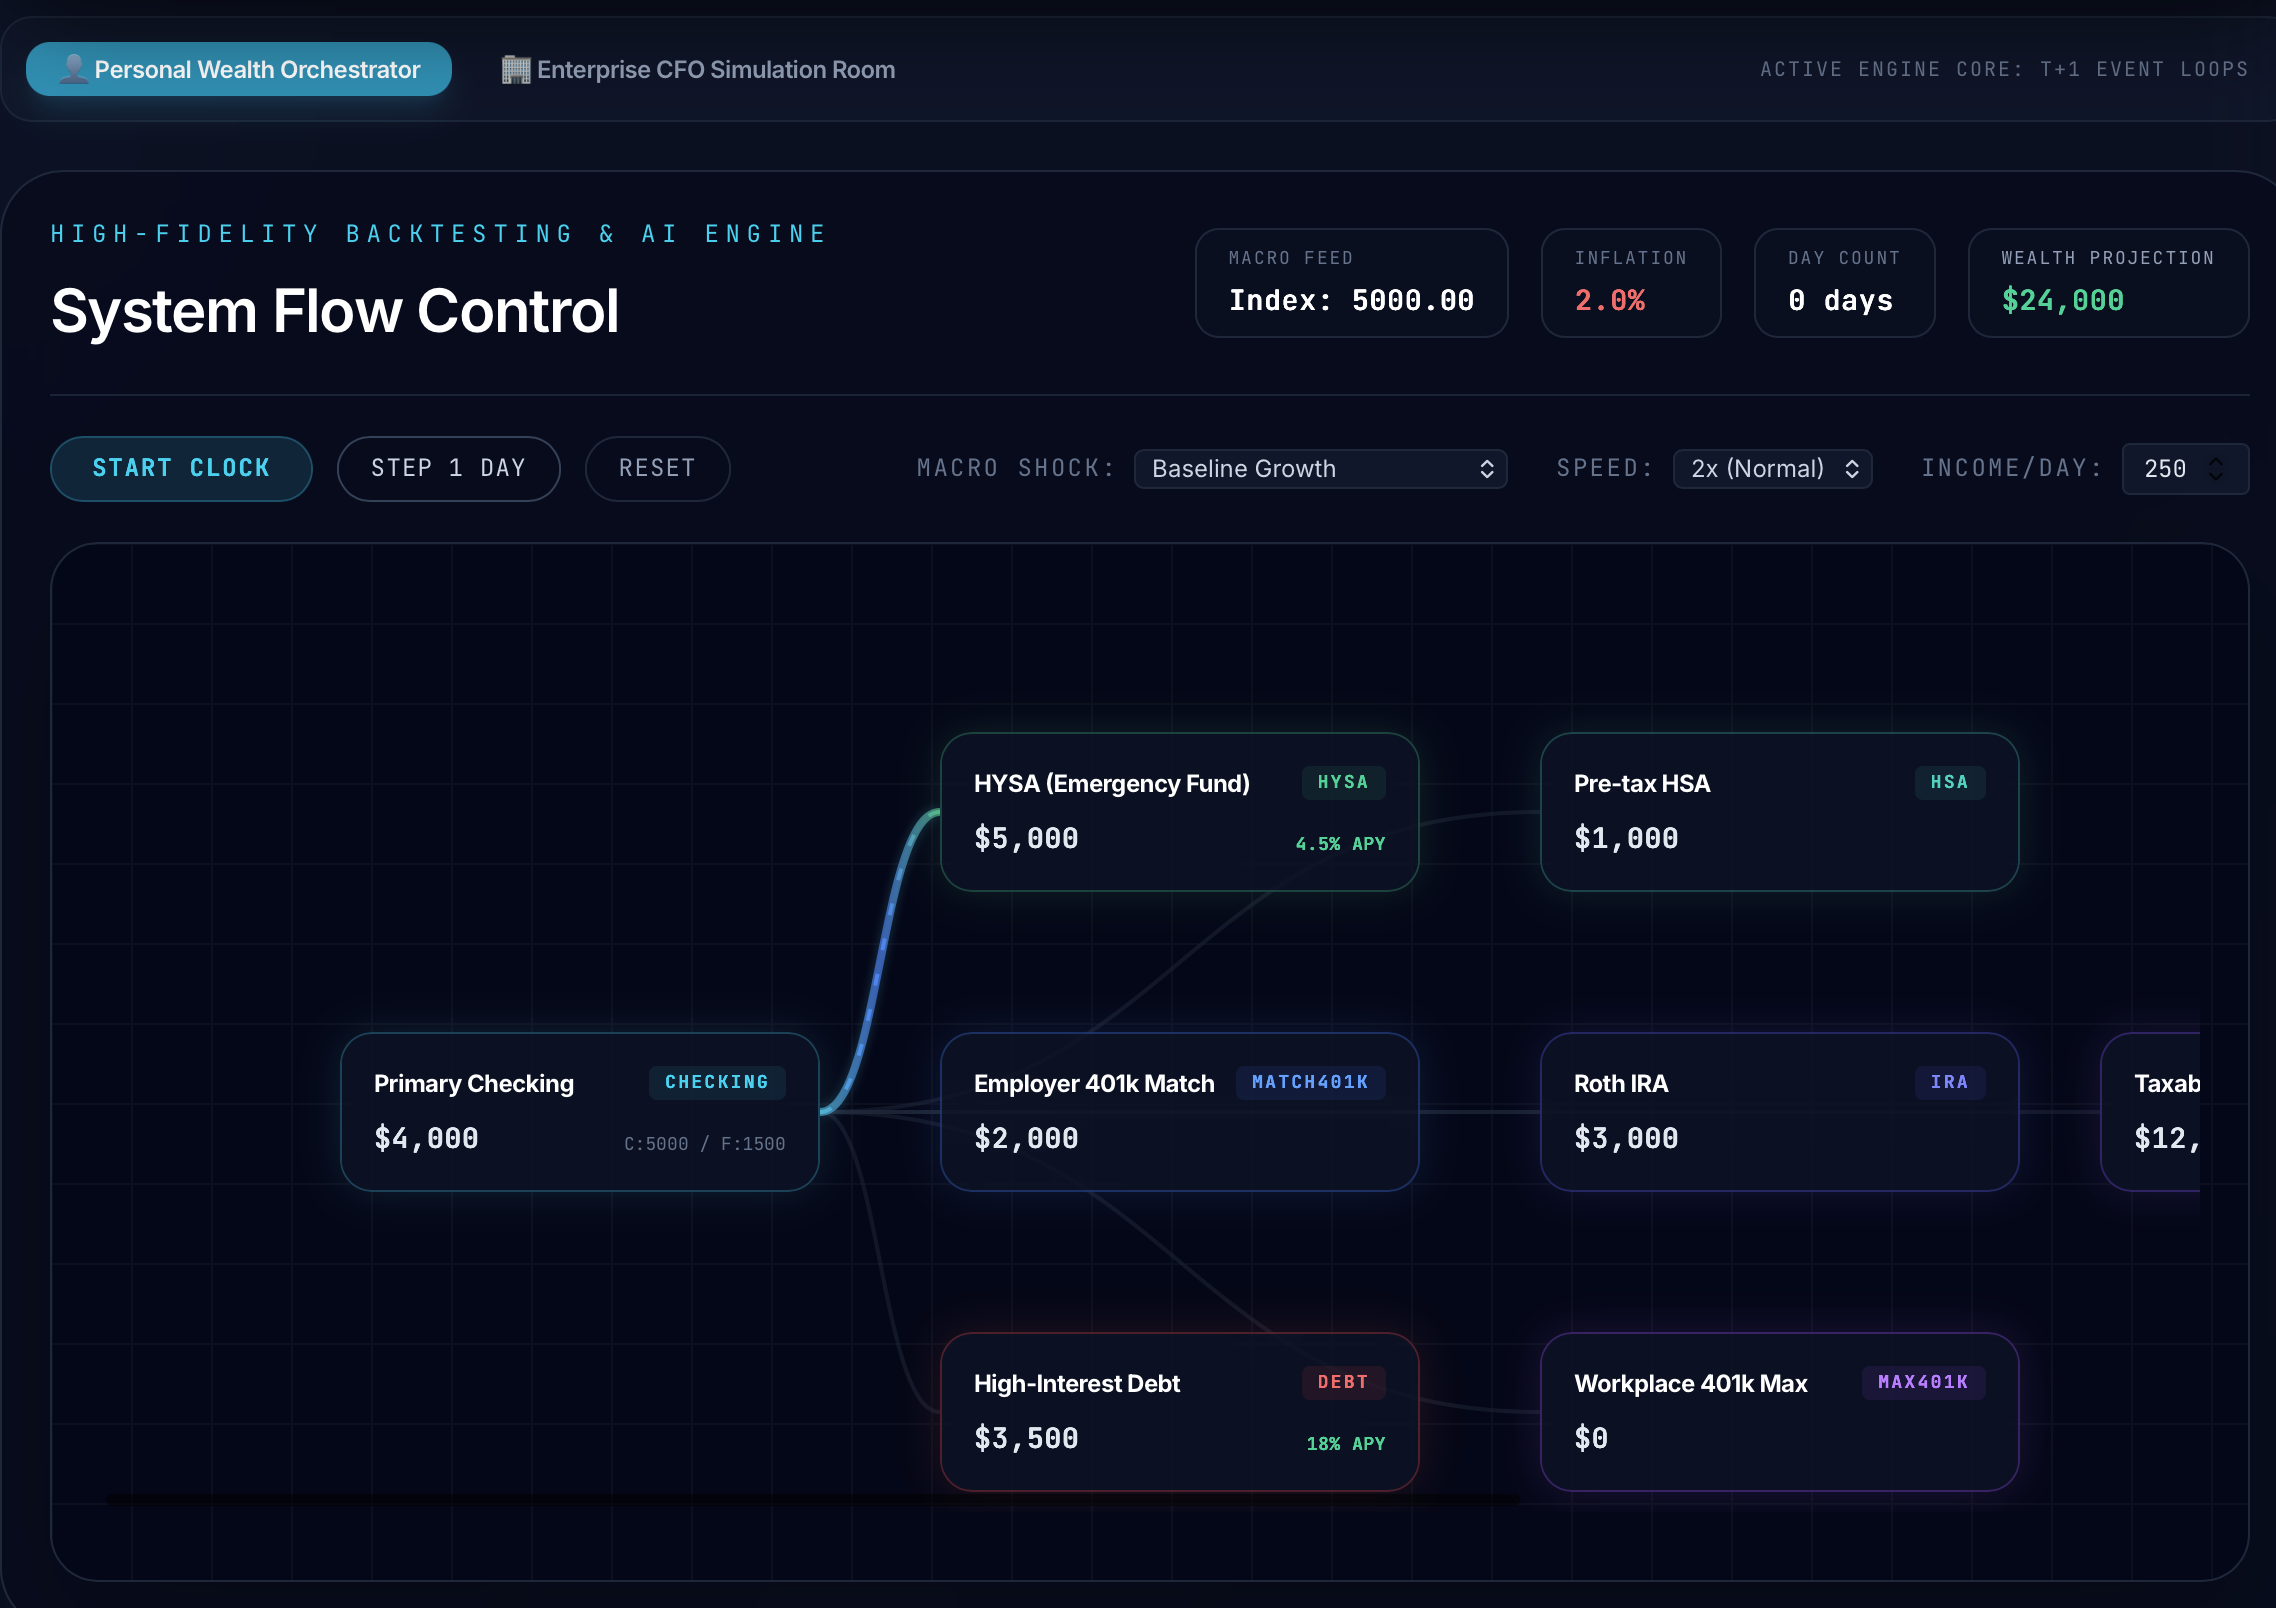
Strategic movement is a powerful tool for building wealth, but its success depends on the timing and the specific terms of the move. To manage this complexity, the Gilinoh Raise & Job-Hop Velocity Calculator offers a structured way to look at these variables. The tool moves beyond simple feelings and applies financial modeling to the career transition process.
It allows you to calculate the exact dollar impact of a move over several years. This ensures that quick gains are not lost to deferred costs. By using a data-driven approach, you can set aside the excitement of a new offer and focus on the math.
The goal is to see if a new role increases your “wealth velocity” or if it just reshuffles your existing pay. In a competitive job market, precision is the difference between a smart move and a costly mistake. You must determine if the new role is worth the “buy-in” cost of leaving your current equity behind.
The Financial Mechanics of the Vesting Cliff
The 401(k) vesting schedule is a common tool used by employers to keep employees from leaving. These schedules usually follow a “cliff” or “graded” model. In a cliff scenario, you own none of the employer’s contributions until you reach a specific milestone—often three years.
At that point, you suddenly own 100% of the funds. If a professional leaves at the 35-month mark in a three-year cliff, they lose every dollar the employer put into their retirement account. For someone earning $150,000 with a 6% match, that is $9,000 per year.
Over nearly three years, the loss exceeds $26,000 when you include basic market growth. This is a significant “exit tax” that must be part of any new offer evaluation. Understanding the type of vesting you are under is the first step in calculating your exit cost.
Table 1: Comparison of Common Vesting Structures
What Is the Job-Hop Velocity Calculator and Who Is It For?
Standard career advice often claims that changing jobs is the most effective way to increase your salary. Data generally supports this idea. According to the Federal Reserve Bank of Atlanta’s Wage Growth Tracker, people who switch jobs have consistently seen higher yearly wage increases than those who stay with their current employers since 2011.
This “loyalty penalty” often pushes professionals to look for new roles to maintain their market value. However, for mid-career professionals, deciding whether to move is rarely just about comparing base salaries. At this stage, compensation packages are more complex and include many different parts.
Mid-career roles often feature complex structures like unvested 401(k) employer matches, performance bonuses, and long-term incentive plans. A simple salary comparison does not account for the “exit costs” of these assets. These costs represent the immediate financial loss an employee takes when walking away.
Modeling Your Full Financial Path
The Job-Hop Velocity Calculator helps address this specific complexity. It provides a clear framework to evaluate the true value of a career change over time. By looking beyond monthly cash flow, the tool shows the long-term impact on your total net worth.

This financial tool is designed for one goal: helping you compare a “stay” scenario against a “switch” scenario with high precision. Unlike basic calculators that only look at hourly rates or taxes, this tool models your full financial path over several years. It includes hidden variables that can cancel out the benefits of a pay raise.
By entering your current pay data and the terms of a new offer, you can project how your wealth will grow in both situations. This data-driven method removes the emotional bias that often comes with a new job title. The calculator answers an important question: is the immediate salary increase enough to cover the loss of deferred pay?
A 15% raise can sometimes lead to a net loss in the first year when you include all costs. Knowing this “break-even” point is vital for any strategic career move. For those early in their careers, a 12% raise is usually a clear financial win, but mid-career professionals face higher stakes.
Who Needs This Tool?
The Job-Hop Velocity Calculator is for mid-career professionals whose total pay includes more than just a base paycheck. For a professional who is two years into a three-year vesting schedule, a 12% raise needs a closer look. Giving up thousands of dollars in unvested matching funds can lower the real value of the new offer.
The calculator accounts for employer match limits, complex vesting schedules, and pro-rated bonus structures. It also factors in immediate transition costs, such as COBRA premiums or the temporary loss of insurance coverage. These “friction costs” often determine if a move is a success or just a lateral financial step.
Data from the Bureau of Labor Statistics shows that employee tenure increases with age. Workers aged 55 to 64 have a median tenure more than three times longer than workers aged 25 to 34. As tenure increases, the financial “tether” to a current employer grows stronger.
The Golden Handcuff Dilemma: A Real-World Scenario
The Scenario That Keeps Mid-Career Engineers Up at Night
Specialized engineering has changed over the last decade. The transition from early-career growth to mid-career stability now involves a major shift in how you receive your pay. It is no longer just about the number on your bi-weekly paycheck.
For many, financial security is increasingly tied to deferred compensation. This is money you have earned on paper but cannot access yet. Consider a mid-career engineer earning a base salary of $120,000 per year who is navigating a “ticking clock” scenario involving retirement and bonus programs.
This engineer is two years into a three-year 401(k) vesting cliff. The employer provides a dollar-for-dollar match on up to 6% of the base salary. Over two years, those contributions total $14,400. Because the engineer has not reached the three-year threshold, that money is effectively a loan from the company.
If they leave today, they forfeit the entire sum immediately. The compensation package also includes an annual performance bonus of 10%. Due to the timing of the fiscal year, half of the current cycle’s bonus—roughly $6,000—is also unvested. Resigning now means leaving that money behind.

The Hidden Cost of a Double-Digit Raise
The situation gets complicated when an external opportunity appears. A recruiter offers a 12% increase in base salary, bringing the new pay to $134,400, plus a $5,000 signing bonus. For many, a double-digit raise is the ultimate benchmark for a career move.
It feels like market validation and promises better monthly cash flow. But the hidden cost is the immediate loss of over $21,000 in unvested assets. When you account for the principal and the market growth of those retirement funds, the loss is substantial.
Switching jobs is no longer a simple comparison of two salary figures. It is a complex calculation of total rewards and the timing of asset realization. Mid-career professionals must recognize that their market value is not just their base salary.
The $4,000 Switching Deficit You Can’t Afford to Ignore
To judge a career move accurately, you must look past the first year. You need to model the full trajectory of your earnings over several years. A simple comparison of Year 1 salaries misses the “transition friction” caused by lost benefits.
When you use a comprehensive job switch model, a pattern of financial loss—the “Switching Deficit”—becomes visible. This model compares two paths: the “Stayer” and the “Switcher.” In this analysis, the Stayer receives a steady 4.1% annual merit increase.
The Switcher gets that initial 12% jump but then sees more modest 3.0% annual raises. This reflects a common reality where companies give smaller raises to employees hired at the top of their salary band. The Switcher also faces immediate out-of-pocket costs like COBRA premiums.
Table 2: Impact of Starting Salary on 30-Year Wealth Projection (Assumes 3% Annual Growth)
The table above illustrates the compounding effect of salary growth over time. A $40,000 difference in starting pay results in a nearly $100,000 difference in annual income by year 30. This highlights why negotiating a higher starting salary is one of the most impactful financial moves you can make.
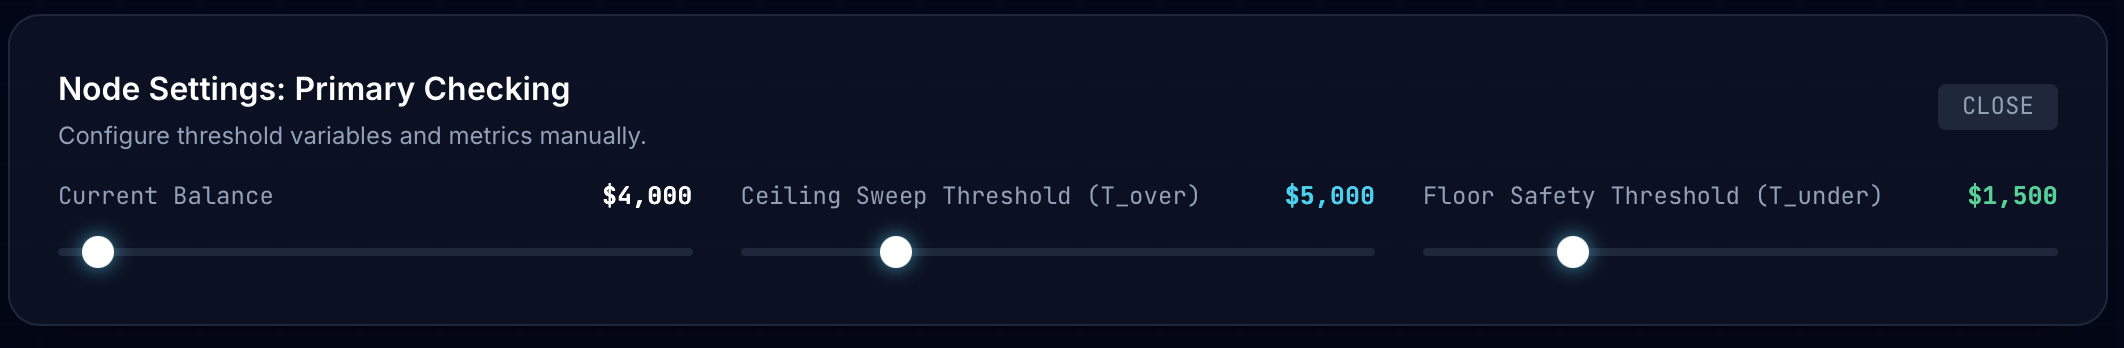
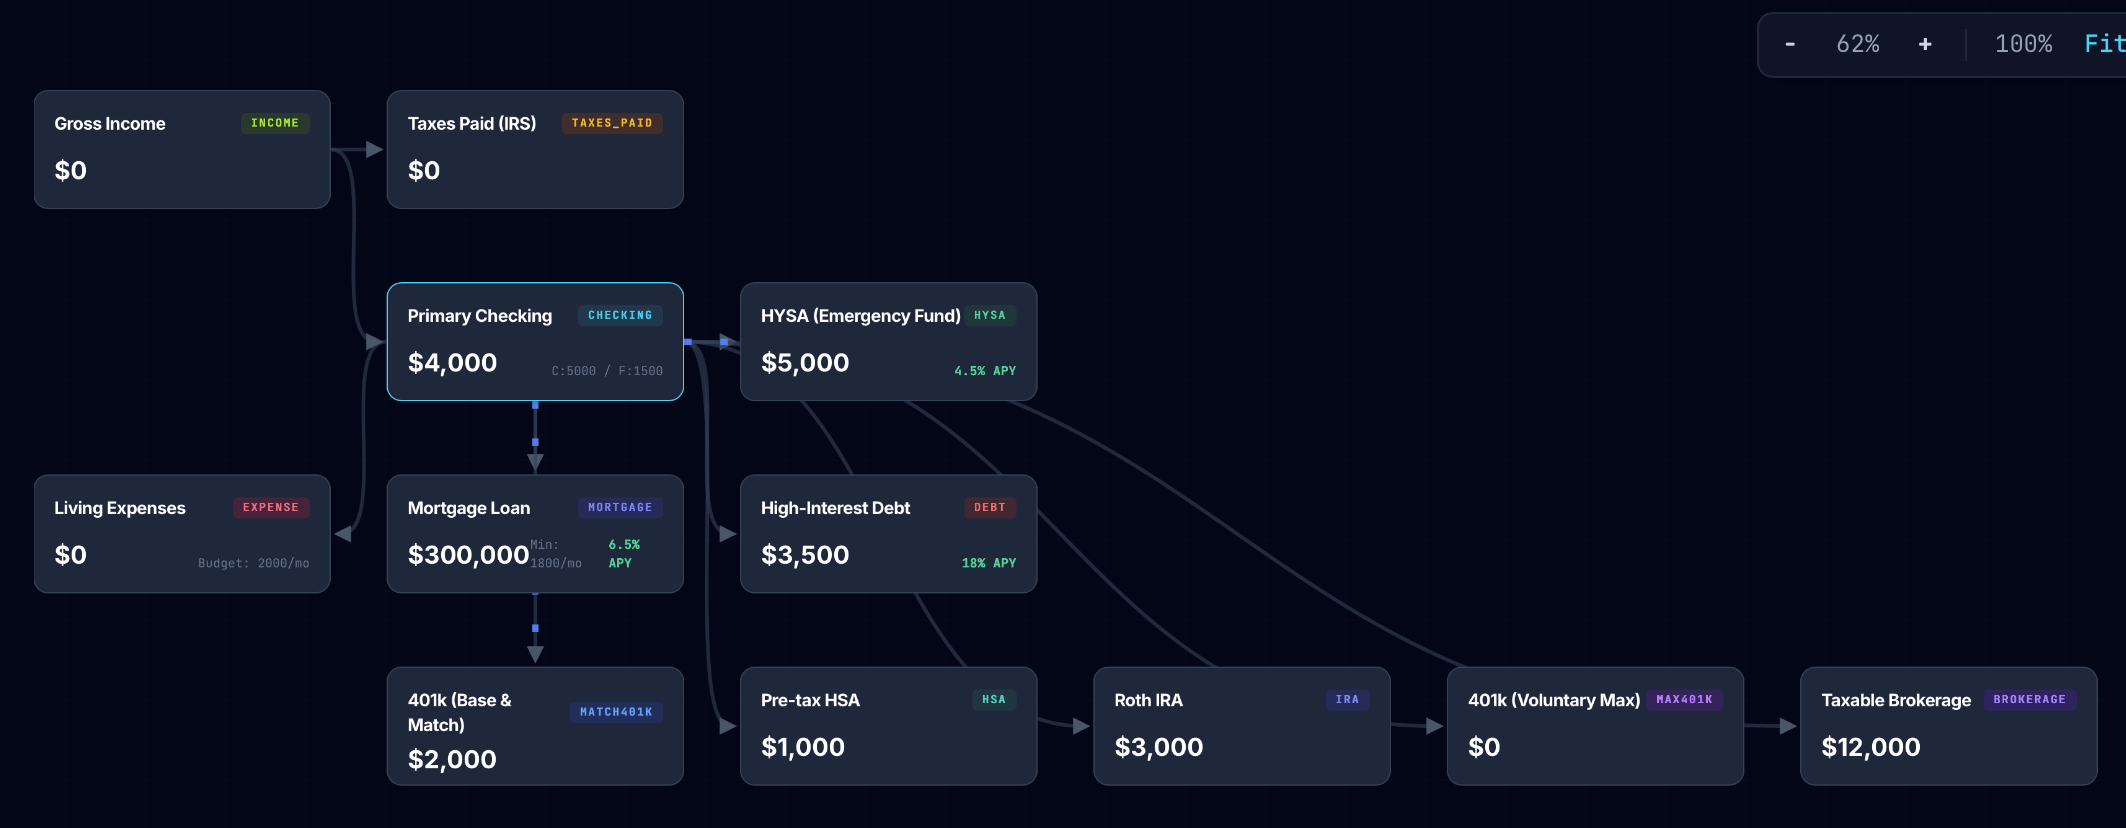
Step-by-Step Configuration: Setting Up the Core Parameters
The accuracy of any financial forecast depends on the quality of the data you provide. In long-term wealth modeling, “Core Parameters” serve as the fundamental assumptions that drive every calculation. These inputs form the architectural foundation of your entire financial plan.
Inaccurate data leads to errors that compound over a multi-decade horizon. Professionals often refer to this as “Garbage In, Garbage Out.” To create a reliable roadmap, you must balance historical market data with conservative personal estimates.
Approaching these variables with professional rigor ensures the final output is useful and actionable. A well-calibrated model identifies potential shortfalls before they become financial crises. It also highlights opportunities for strategic changes in tax planning or asset allocation.
Starting Base Salary: Establishing the Baseline
The calculator uses a default starting base salary of $120,000. This figure serves as a benchmark for mid-career professionals in sectors like technology, finance, or corporate management. It represents a typical earner in a major metropolitan market today.
For the model to be effective, you must adjust this to your current “Total Cash Compensation.” Use the gross annual salary listed on your most recent employment contract or W-2. Accuracy here is vital because your salary is the primary engine of your savings rate.
Distinguish clearly between cash salary and non-cash benefits. Health insurance premiums and employer-paid life insurance are valuable, but they do not belong in the “Base Salary” field. Only include income that appears on your payroll as regular cash earnings.
If you are currently between roles, use a conservative estimate based on verified market data. Professional sites like Glassdoor or specialized industry salary surveys provide reliable ranges. Always lean toward the lower end of these ranges to maintain a margin of safety.
Combined Tax Rate: Understanding Effective Liability
The default combined tax rate is set at 32%. Many users confuse their “marginal tax bracket” with their “effective tax rate.” It is essential to use a realistic combined rate that includes federal, state, and local taxes to see your true take-home potential.
Strategic career moves often result in salary increases that far exceed internal annual raises. While internal increases might hover between 3% and 5%, external moves can yield 10% to 20% gains . Because of these potential jumps, you should update your base salary in the calculator every year.
Configuring the Stayer and Switcher Scenarios
The Strategic Assessment: A Quantitative Approach
A mid-career engineer currently earns a base salary of $120,000. They are two years into a three-year vesting cliff for their 401(k) employer contributions. A recruiter presents an opportunity featuring a 12% increase in base compensation and an elevated title.
However, a professional transition requires more than a surface-level look at salary. A comprehensive financial analysis must determine the true economic impact of the move. This is where a jobs switch calculator becomes an essential tool for high-level decision-making.
Sophisticated career moves look beyond nominal increases to evaluate the total rewards package. In many cases, the financial assets left behind at a current firm outweigh the immediate gains of a new role. You must determine if the projected increase remains positive after accounting for forfeited equity.
The Comparative Framework: Stayer vs. Switcher Parameters
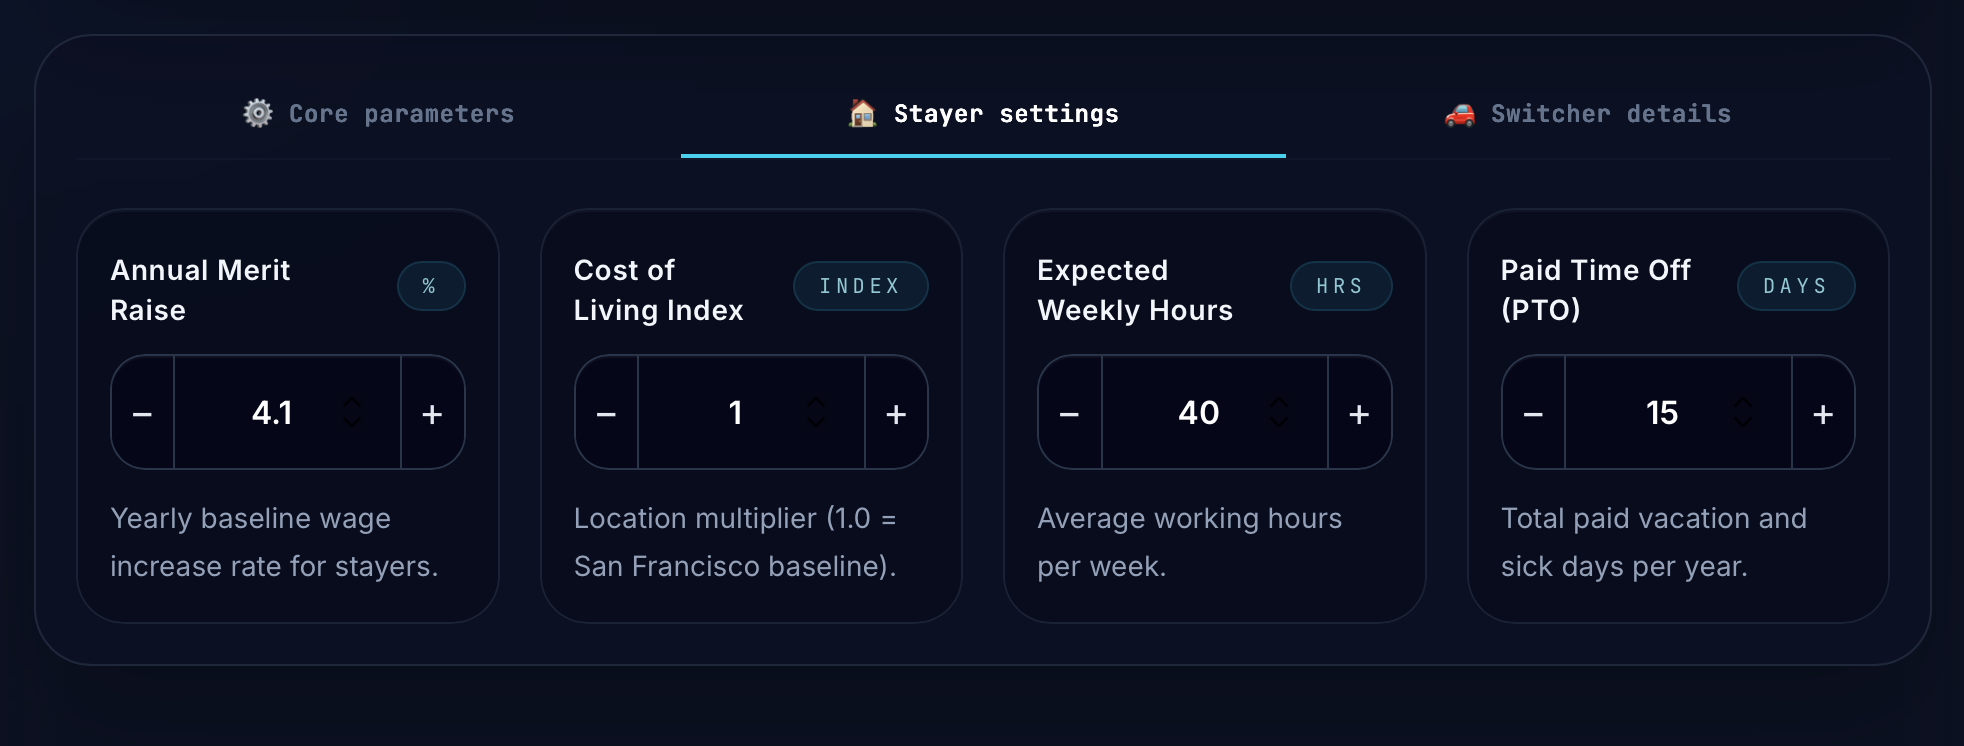
To model long-term financial outcomes, we establish a baseline for two distinct career paths. The “Stayer” trajectory assumes consistent tenure with the current employer. This path benefits from a steady 4.1% annual merit increase, which aligns with current market standards .
The Stayer path prioritizes the preservation of benefits and the realization of long-term incentive plans. It assumes the employee has already cleared the initial learning curve and is operating at peak efficiency. This stability often leads to more predictable bonus payouts.
Conversely, the “Switcher” trajectory involves a strategic move every three years. This path assumes a 12% salary increase upon joining a new firm, supplemented by a $5,000 signing bonus . However, in the years between these transitions, the annual raise is modeled at a lower 3.0% rate.
Table 3: Stayer vs. Switcher Financial Parameters
The “Switcher” profile includes significant financial friction. The immediate loss of 100% of unvested employer matches represents a substantial reduction in net worth. For our engineer, this loss is calculated at approximately $21,000, a figure that often shocks those who haven’t run the numbers.
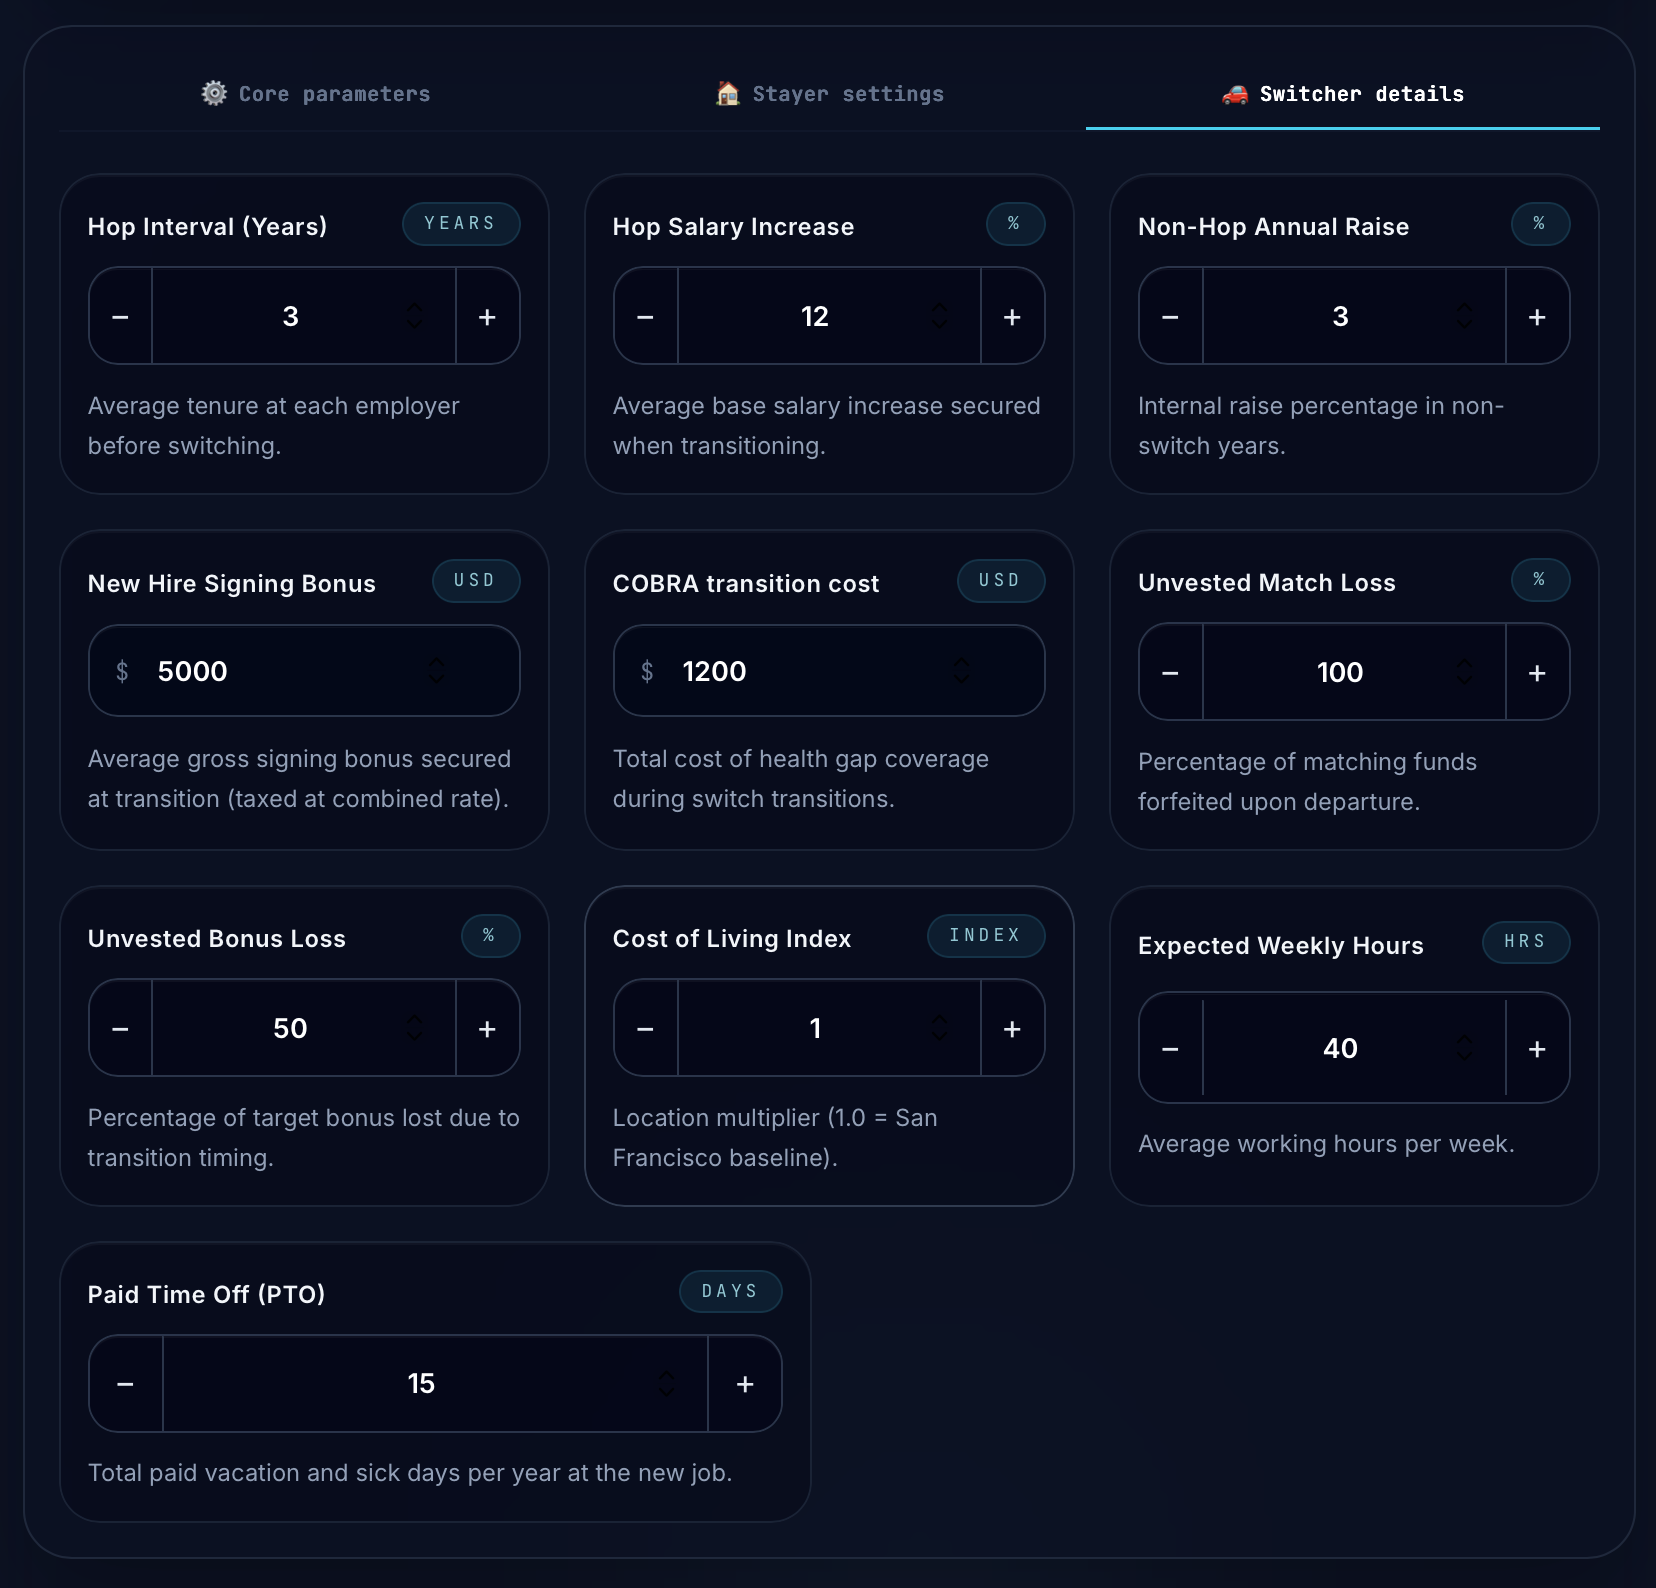
Step-by-Step Configuration:
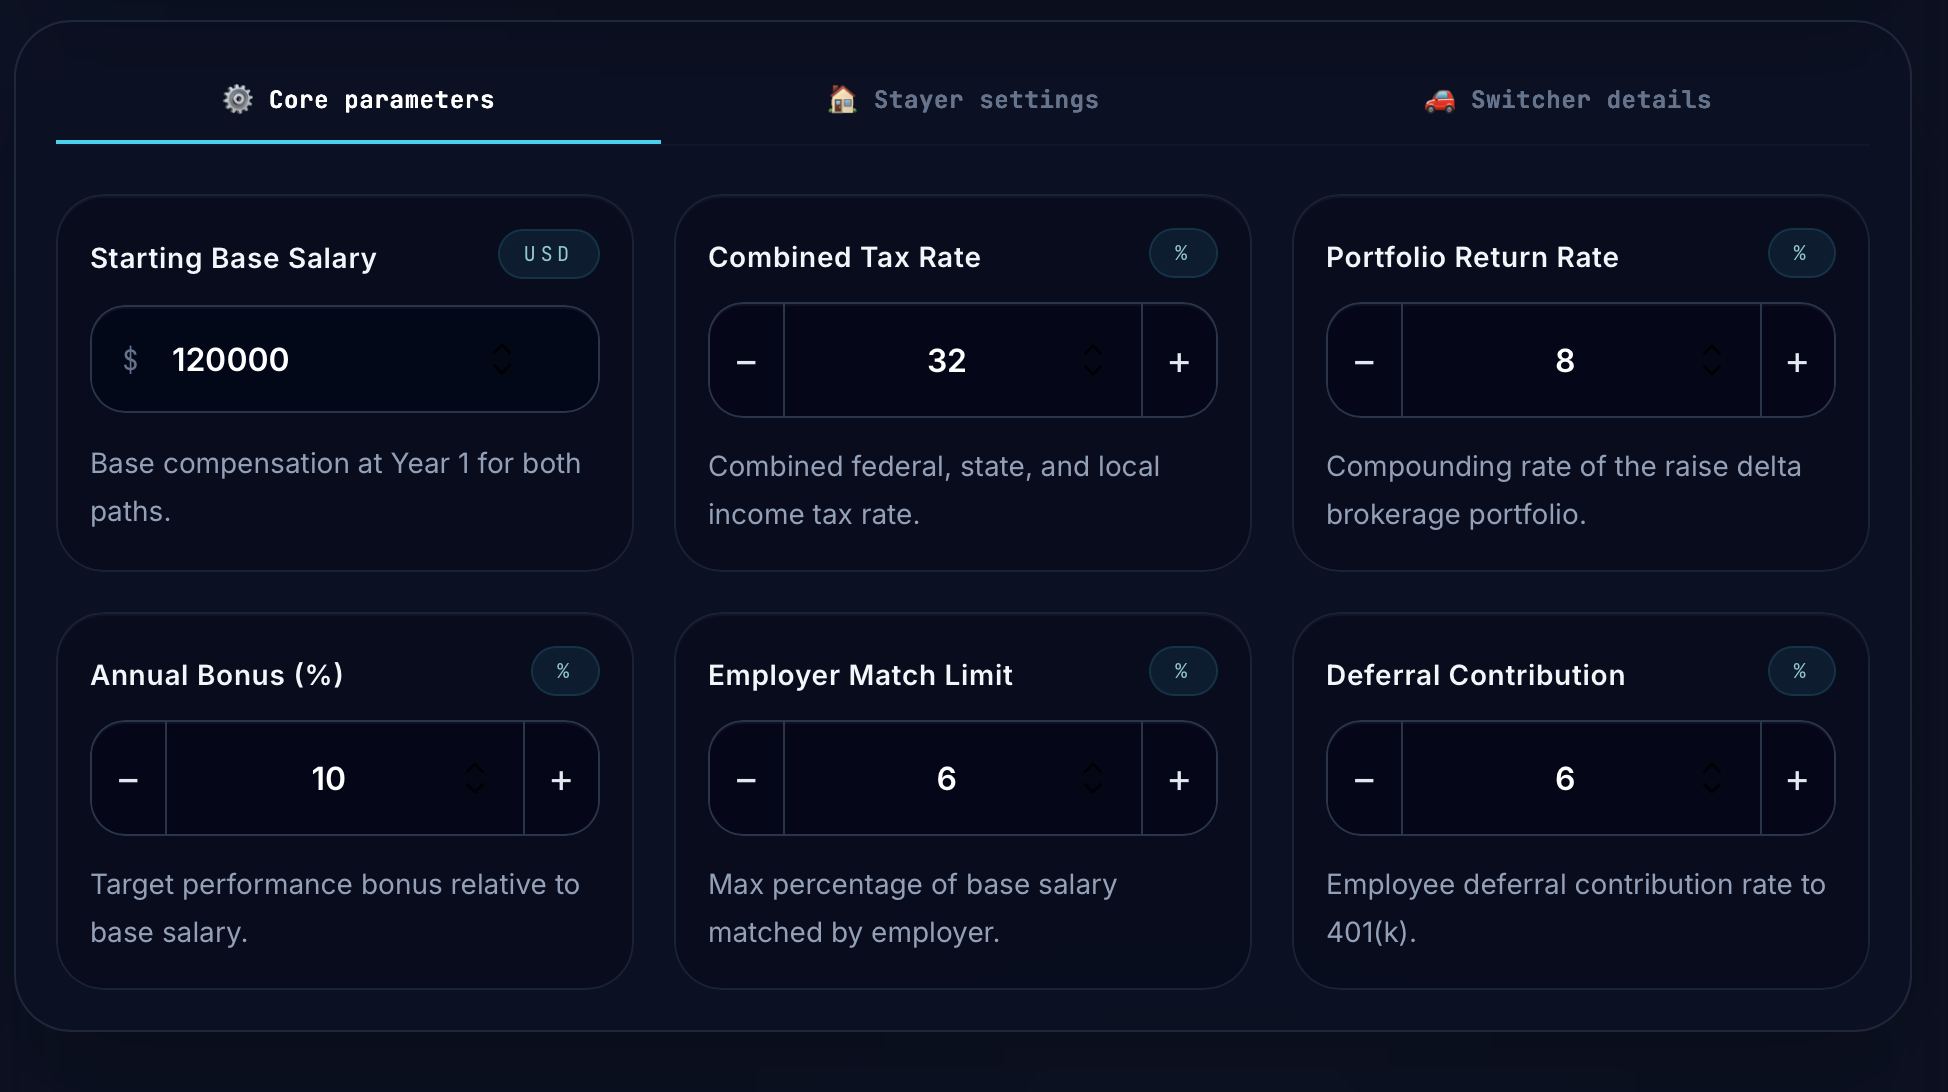
Open the Core Parameters tab and enter:
-
Starting Base Salary: $120,000
-
Combined Tax Rate: 32%
-
Portfolio Return Rate: 8%
-
Annual Bonus: 10%
-
Employer Match Limit: 6% (generous matching program)
Open the Stayer Settings tab:
-
Annual Merit Raise: 4.1%
Open the Switcher Details tab:
-
Hop Interval: 3 Years (timing the jump at the cliff end)
-
Hop Salary Increase: 12%
-
Non-Hop Annual Raise: 3.0%
-
New Hire Signing Bonus: $5,000 (used to offset matching losses)
-
COBRA Transition Cost: $1,200
-
Unvested Match Loss: 100% (forfeiting the matches accumulated during the 2 years before the transition)
-
Unvested Bonus Loss: 50%
Interpreting the Output: The Switching Deficit
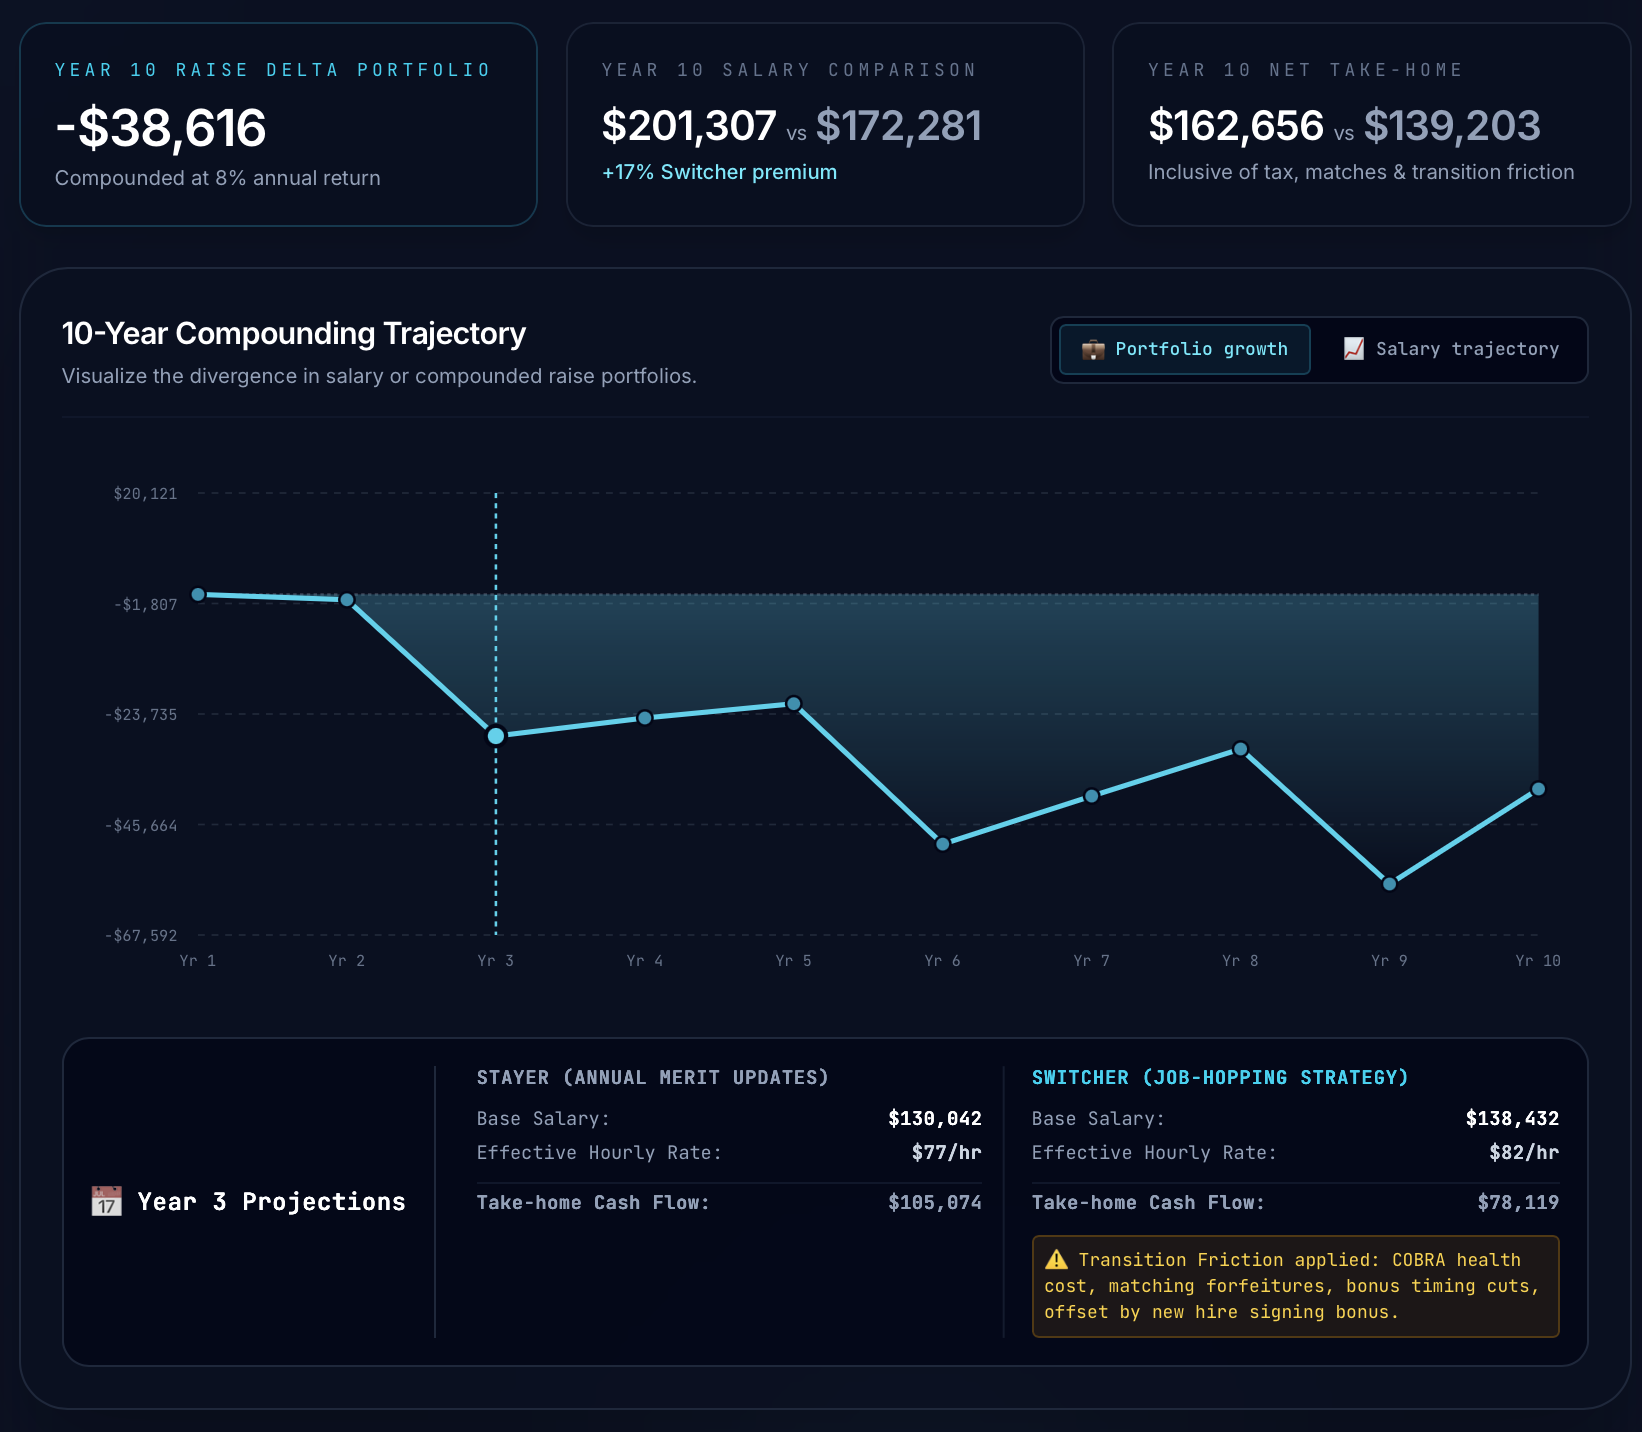
The Year 3 Trap: When Switching Hurts More Than It Helps
Here’s the thing nobody tells you about that shiny job offer: the numbers can look great on paper for about two years. Then reality hits. According to the calculator, the Switching Deficit becomes painfully visible in Year 3.
That’s when the Switcher’s net income actually dips below the Stayer’s. We’re talking about a negative delta of roughly -$4,000. This happens because the initial salary bump and signing bonus were insufficient to cover the forfeited assets and the lower subsequent raises.
Table 4: Summary of Hidden Transition Costs
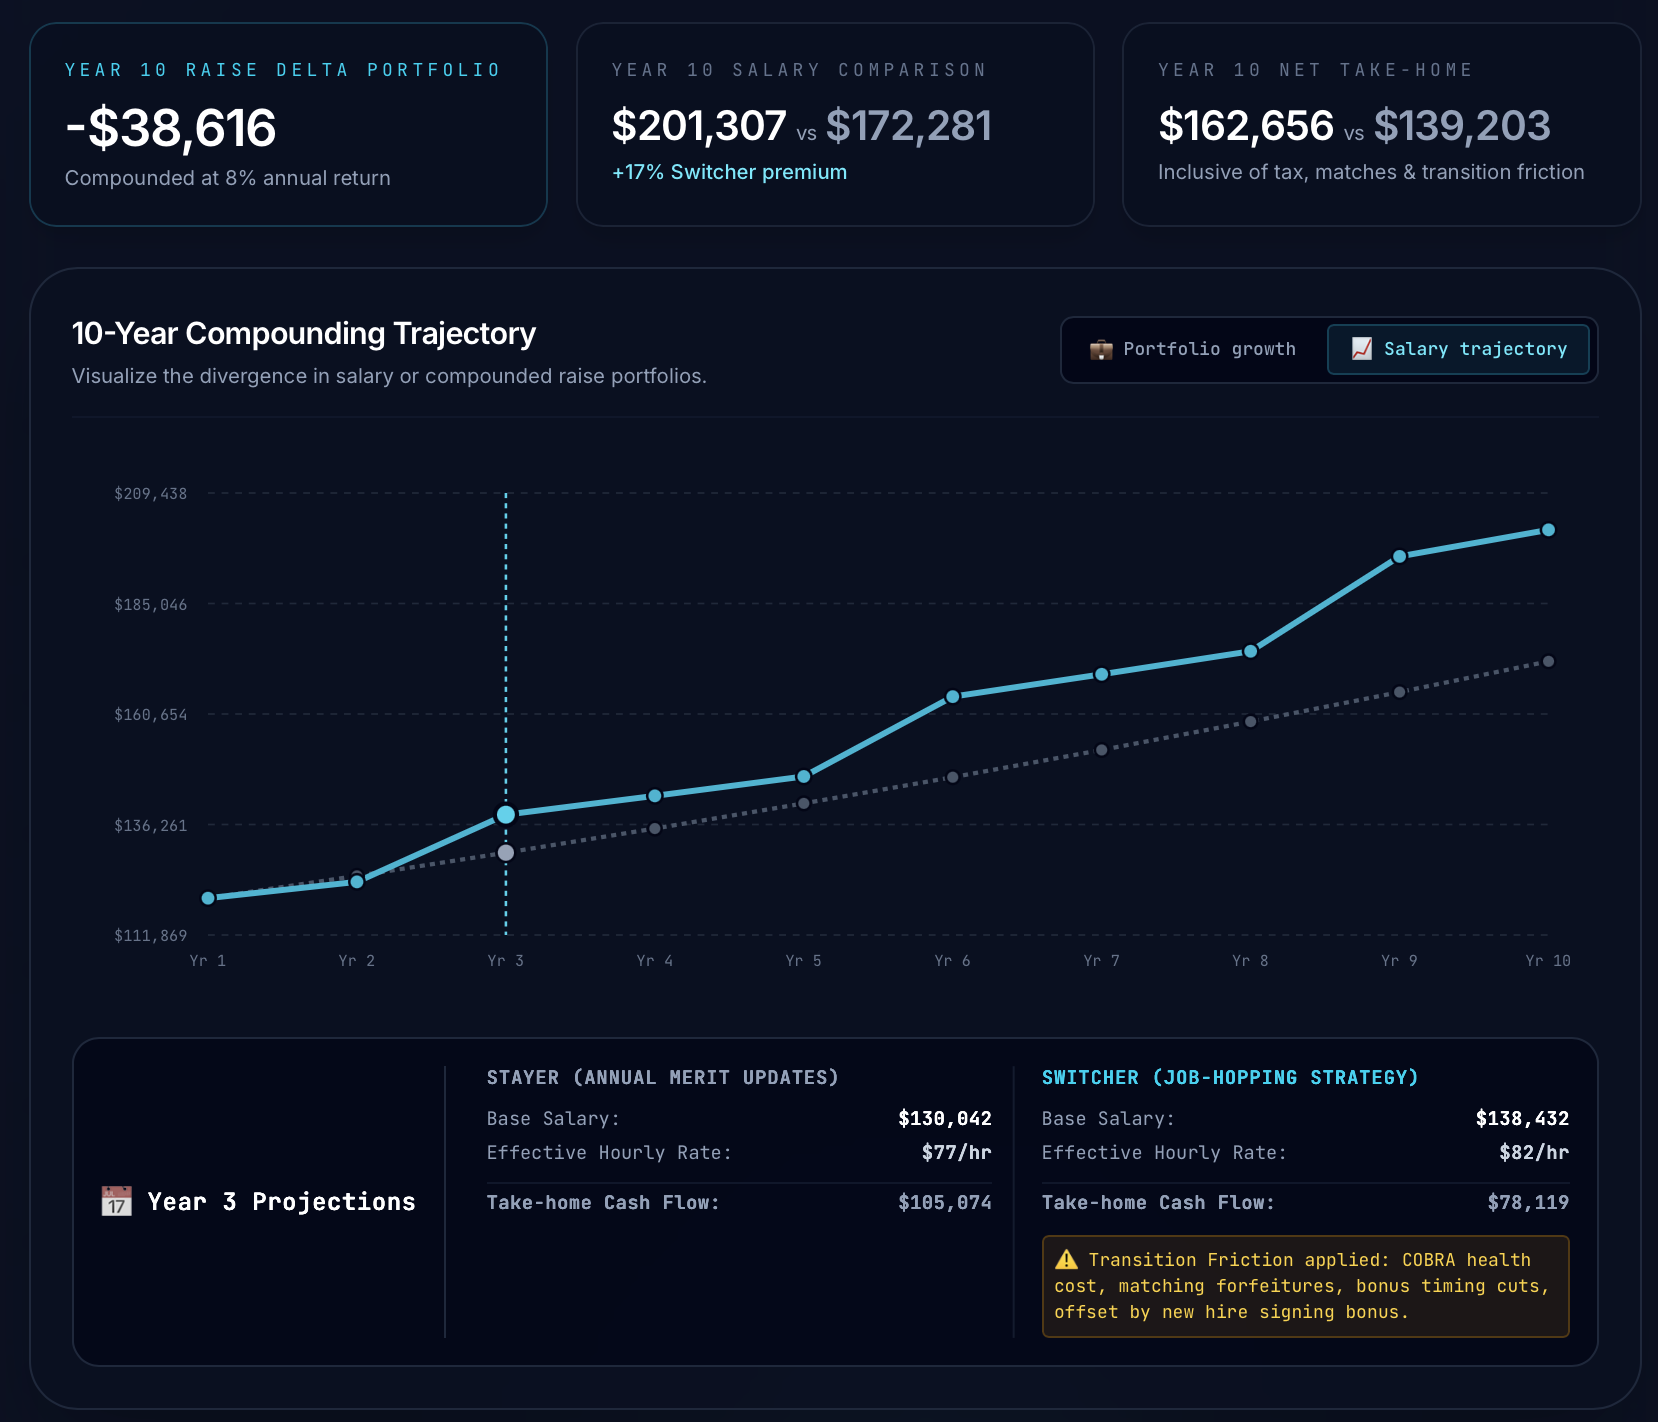
Trajectory Insights
The “Switching Deficit”: In Year 3, the switcher’s take-home pay dips below the stayer’s by -$26,955 (approx. -$27,000) due to forfeiting $22,900 in cumulative retirement matches, plus transition costs.
How to Use the Calculator as a Negotiation Tool
The Exact Number You Need to Ask For
Here’s the thing about calculators that actually work for a jobs switch—they tell you the precise dollar figure that makes the move worth it. Not a vague “ask for more” but a real, hard number. In our earlier scenario, the engineer at $120,000 faces a major hurdle.
A $5,000 signing bonus only yields $3,400 after-tax (leaving him with the $27,000 deficit).
Jumping ship for a 12% raise sounds great until you realize you’re forfeiting over $21,000 in unvested employer matches. To make this move truly profitable, the engineer shouldn’t just accept the 12% raise. They should use the calculator’s output to negotiate a higher signing bonus or a starting salary that offsets the $21,000 loss.
To completely break even on this transition in Year 3, he would need to negotiate a signing bonus of at least $39,700 gross (to net $27,000 after 32% tax), or demand a higher base raise than 12%.
I recommend presenting these numbers clearly to the hiring manager. You can say, “I am very excited about this role, but leaving my current firm means walking away from $21,000 in vested benefits. Can we bridge that gap with a sign-on bonus?” This moves the negotiation from a request for “more” to a request for “fairness.”
Conclusion: Turn Your Jobs Switch into a Wealth-Building Move
The Bottom Line: Know Your Numbers Before You Leap
A bigger paycheck sounds good, but as we’ve seen, hidden costs can eat that raise alive. I have seen too many talented professionals take a step back financially because they didn’t do the math. By using a quantitative approach, you ensure that every career move is a step toward greater wealth.
Don’t let the excitement of a new title blind you to the reality of your balance sheet. Use the tools
FAQ
Why is a 12% raise sometimes considered insufficient for a job switch?
A 12% raise may not cover the ‘exit costs’ of leaving a current role, such as forfeited unvested 401(k) matches or pending bonuses. In many cases, these lost assets can take years to recover through the new salary alone.
What is cliff vesting and how does it affect a career move?
Cliff vesting is a schedule where you gain full ownership of employer contributions only after reaching a specific milestone, often three years. Leaving before this milestone means forfeiting the entire amount, which can create a significant financial deficit that a new salary must offset.
How can I use the calculator’s data during salary negotiations?
You can present the specific dollar value of your forfeited benefits to a hiring manager to justify a higher signing bonus or starting salary. This shifts the conversation from a subjective request to a data-driven negotiation aimed at bridging a documented financial gap.
What are the common ‘friction costs’ associated with changing jobs?
Friction costs include immediate expenses like COBRA premiums for health insurance, administrative fees, and the loss of prorated performance bonuses. These costs, combined with lost vesting, determine the ‘break-even’ point of a new job offer.
Why might a ‘Stayer’ eventually outearn a ‘Switcher’ in the long term?
While switchers get an initial bump, they often receive lower annual merit increases if they are hired at the top of their salary band. Over several years, the consistent, slightly higher raises and preserved benefits of a ‘Stayer’ can lead to a higher total net worth.
What is the ‘Switching Deficit’ mentioned in the guide?
The Switching Deficit is the point where a professional’s net income falls below what they would have earned by staying in their previous role. This typically occurs around Year 3 when the initial signing bonus and raise are outweighed by lower annual growth and lost retirement funds.
References
[1] • Unexpected modal handling 𝗙𝗿𝗮𝗺𝗲𝘀 & 𝗪𝗶𝗻𝗱𝗼𝘄𝘀 • Switching between frames • Nested frame handling •.
[2] ### Vice President CWPMICH at College Works Painting (2009-11-01 – 2011-09-01) **President/Vice Pres.
[3] ## Current Position **Network Engineer**
[4] #TalentAcquisition #HRTech #EmployerBrand #AIinHR #RecruitingStrategy ### 3w The job market may be.
[5] Let’s connect if you’re looking for someone who brings both technical expertise and fresh perspectiv.